
U.S. Market Research
2026 US Camper Van Rental Market Report
An analysis of supply, demand, pricing, and geography across the US Class B and conversion camper van rental market.
The US camper van rental market, by the numbers
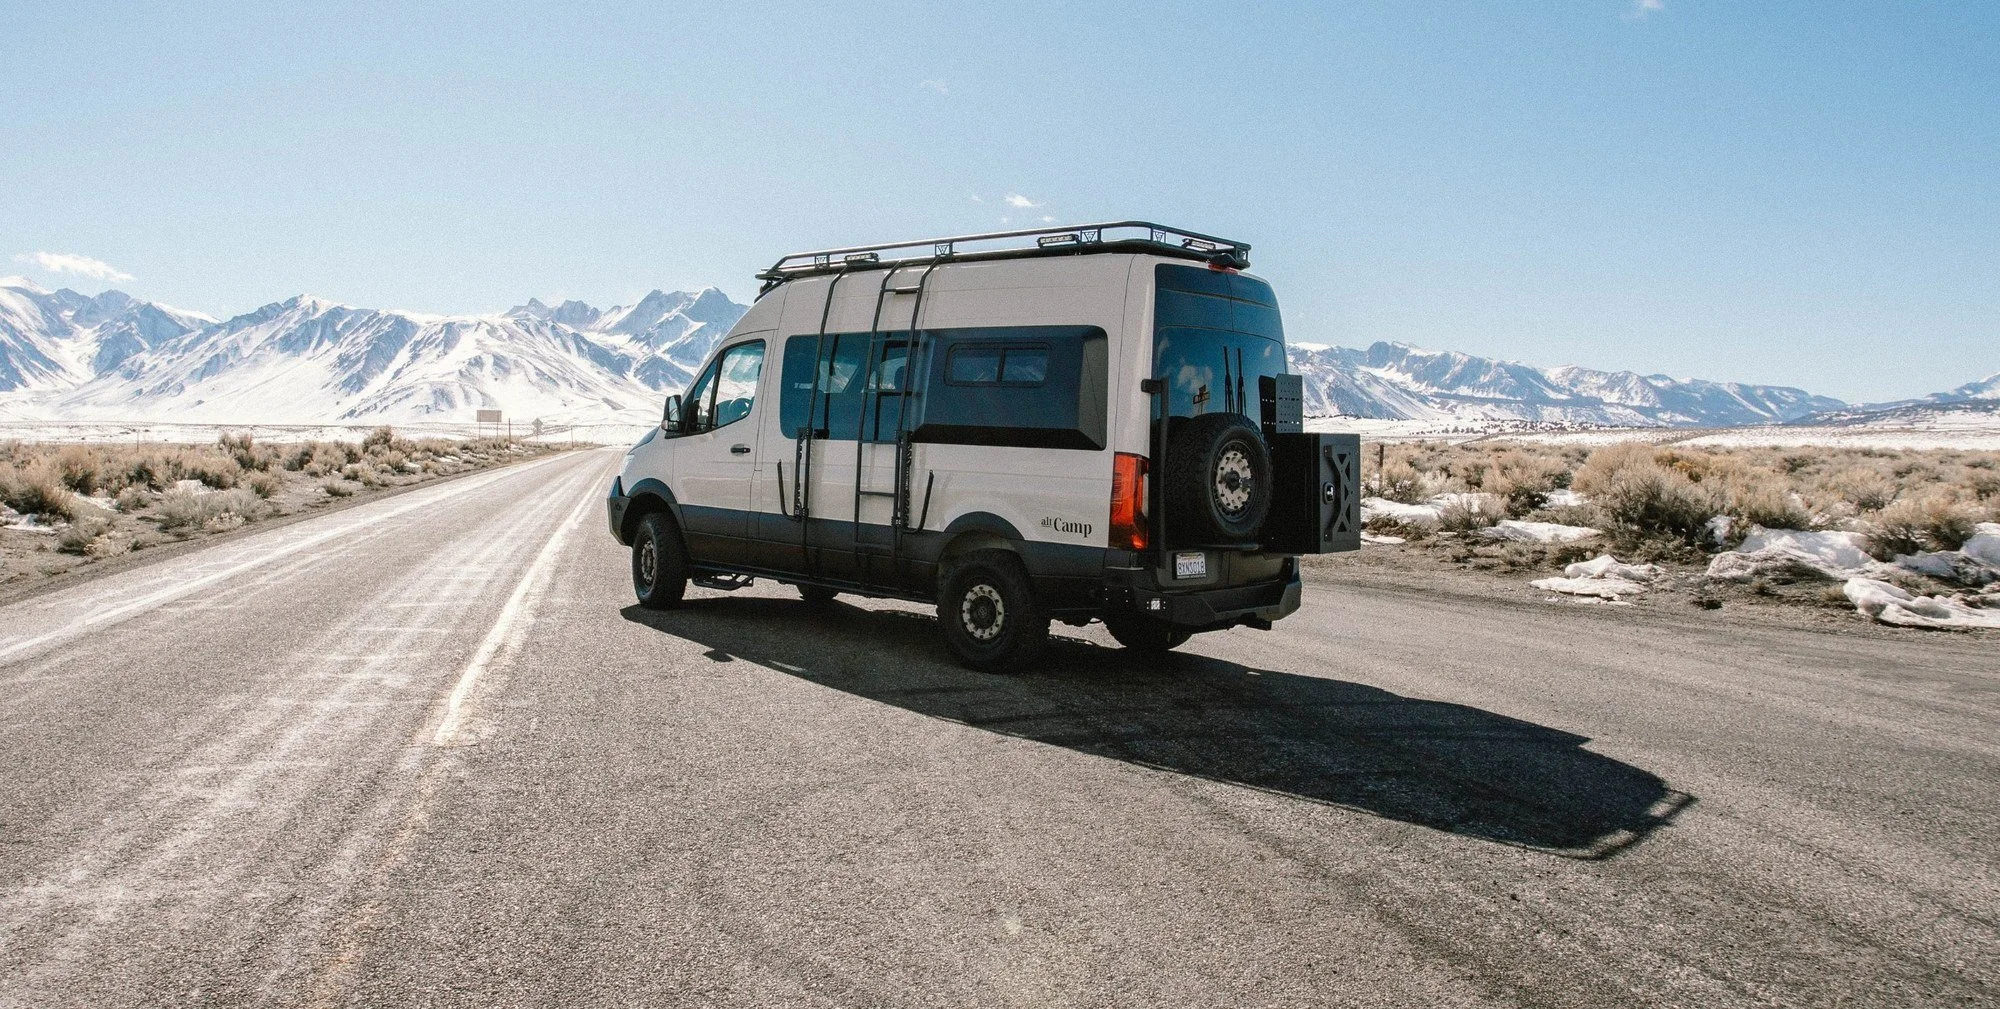
The US camper van rental market sits at an interesting inflection point in 2026. Supply is mature enough to matter, with 3,243 active rental listings in our dataset spanning every US state. The fleet is modern, heavily private, and concentrated in a handful of western states. Demand is large enough to sustain meaningful supply, with 122,270 monthly US searches tied to camper van rentals, working out to roughly 40 searches per listing every month.
But those aggregate numbers mask sharp regional mismatches. Los Angeles has plenty of listings and moderate search volume. Las Vegas has moderate supply and very high search volume. Seattle sees almost as many searches as Los Angeles on two-thirds the listings. These gaps are where the real market structure lives.
The report breaks out the supply, demand, pricing, and geographic story in detail, with the goal of giving operators, hosts, investors, and travelers a shared factual picture of what the US camper van rental market looks like heading into the 2026 travel season.
Eight findings that define the 2026 market
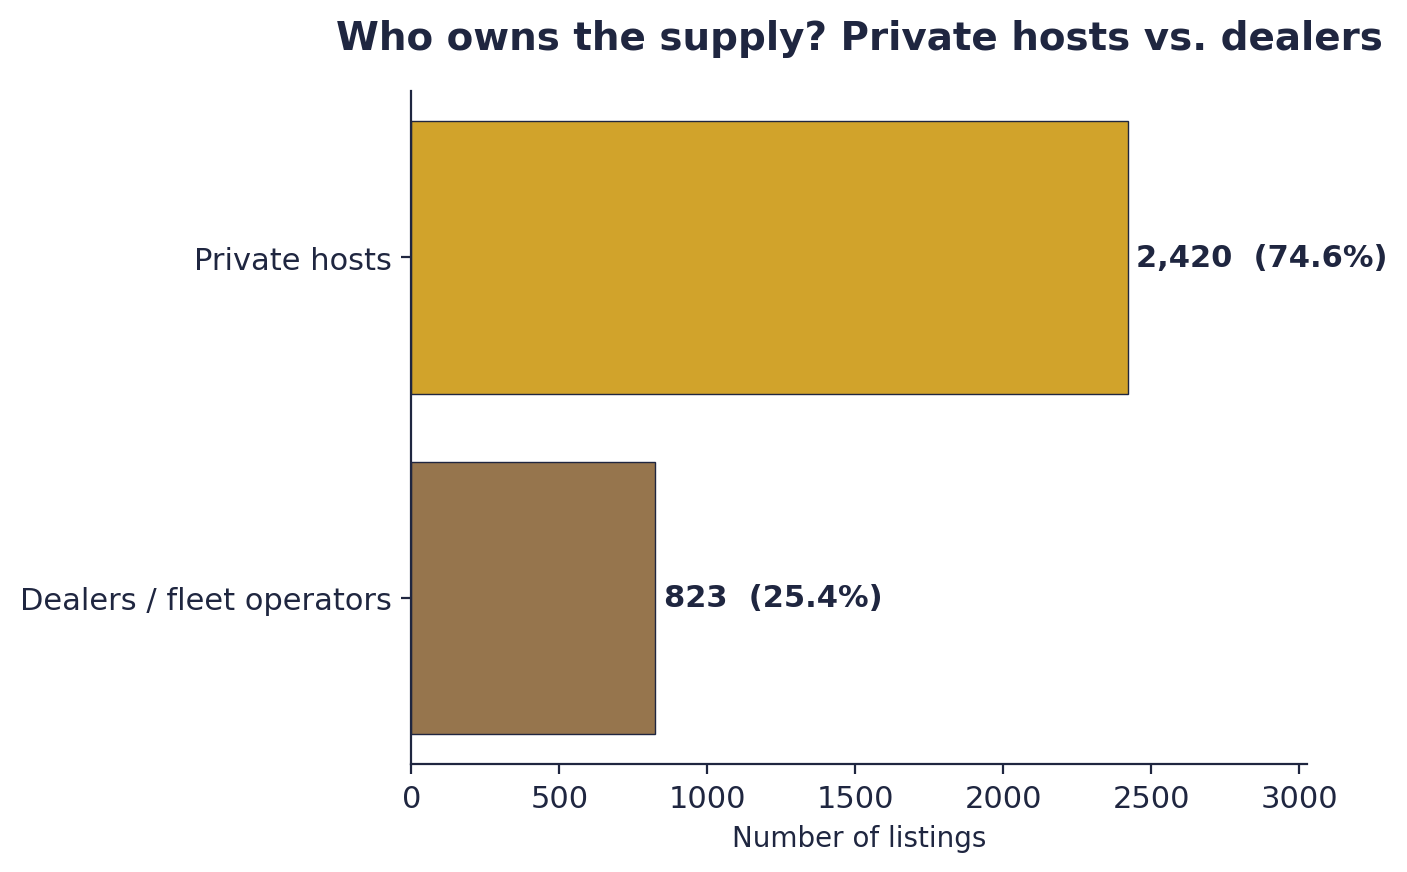
- Finding 01 Supply is dominated by private hosts. 74.6% of listings come from private individuals rather than dealerships or rental fleets. This is a consumer-to-consumer market at its core.
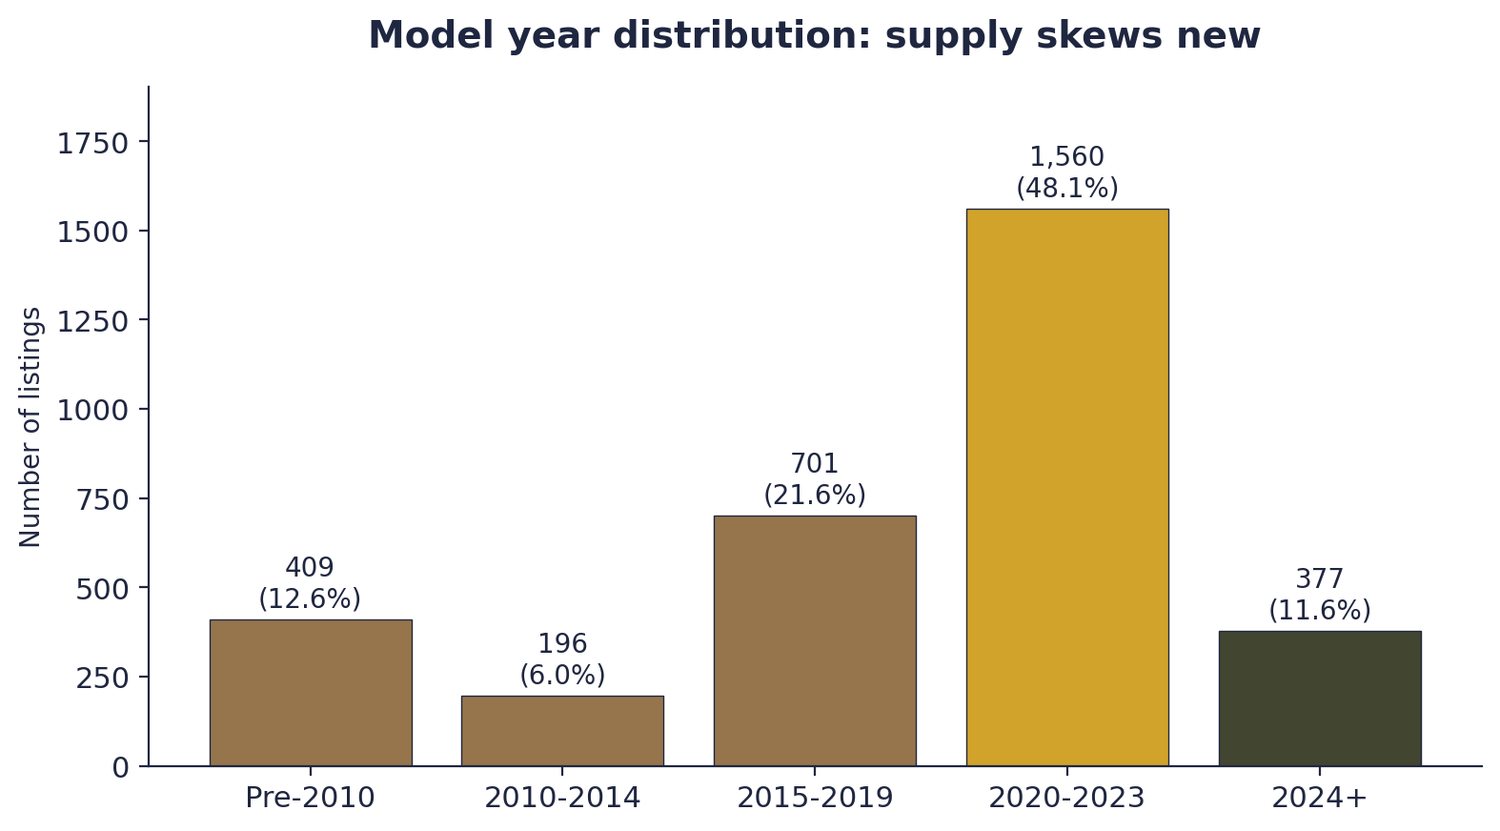
- Finding 02 The fleet is unusually new. Nearly half the fleet (48.1%) is model year 2020 to 2023, and 59.7% is from 2020 or later. The median model year is 2021.
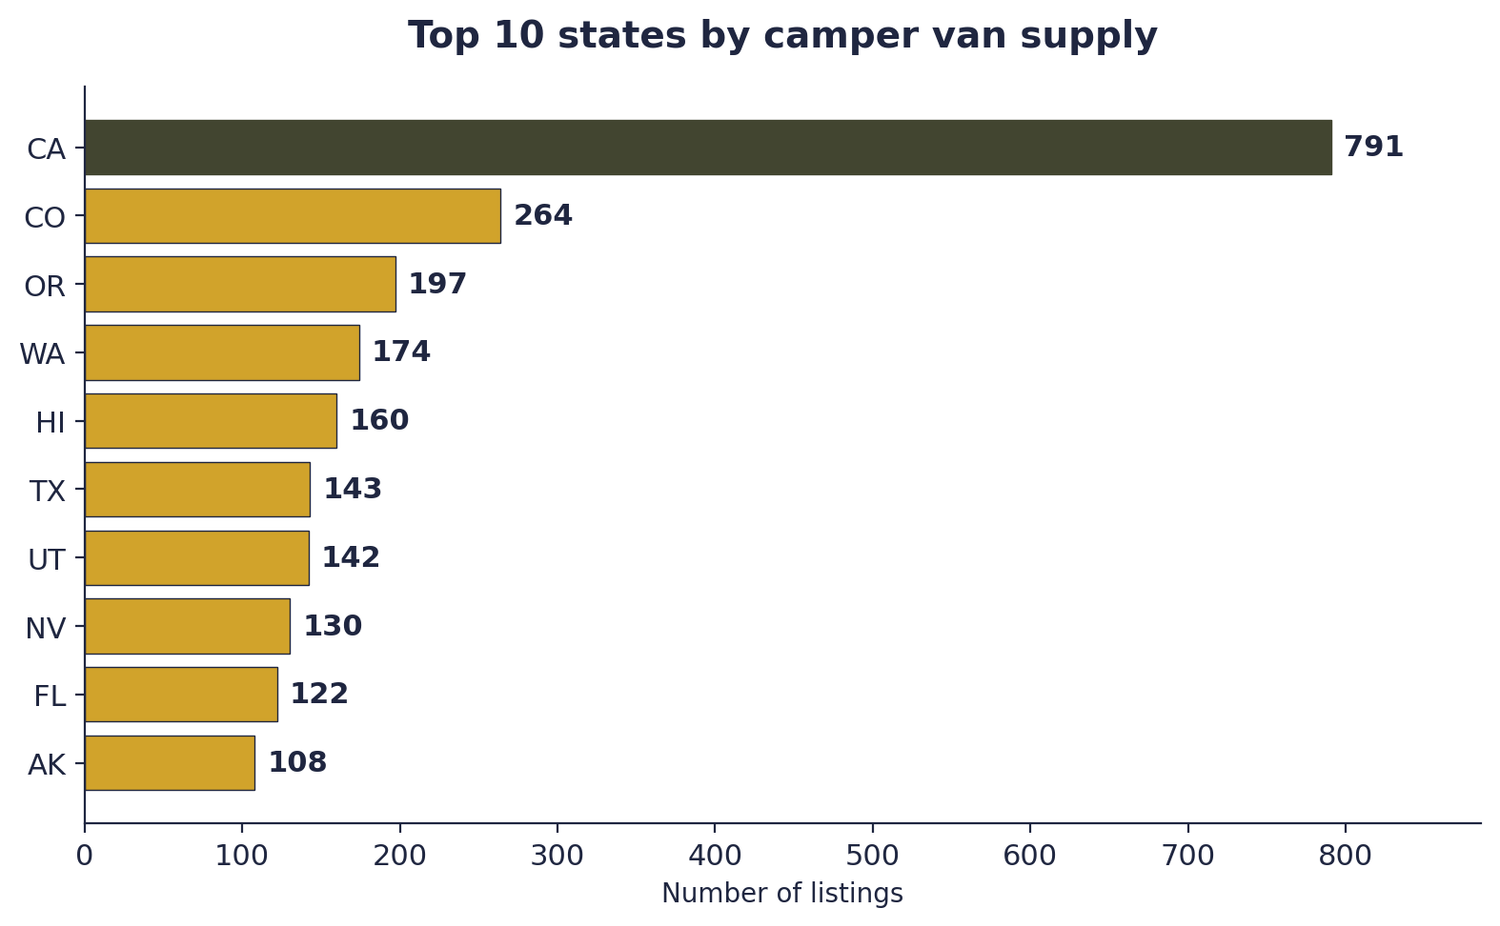
- Finding 03 California holds roughly a quarter of the analyzed supply. 791 of 3,243 listings in our dataset (24.4%) are in California, more than triple the next-largest state. Colorado, Oregon, Washington, and Hawaii round out the top five.
- Finding 04 Supply is concentrated in Western metros. The top 15 MSAs hold more than half of all listings, with Los Angeles, Denver, Portland, San Diego, and San Francisco leading. Only 4 of the top 15 metros are East of the Mississippi.
- Finding 05 Mercedes-Benz is the platform of choice. Among listings where a chassis platform is identifiable, 34.3% are built on Mercedes-Benz Sprinter chassis. Ford is second at 22.3%.
- Finding 06 Winnebago leads the builder market. Of listings where the camper van manufacturer is identifiable, Winnebago holds 38.2% share, more than twice the next-largest brand.
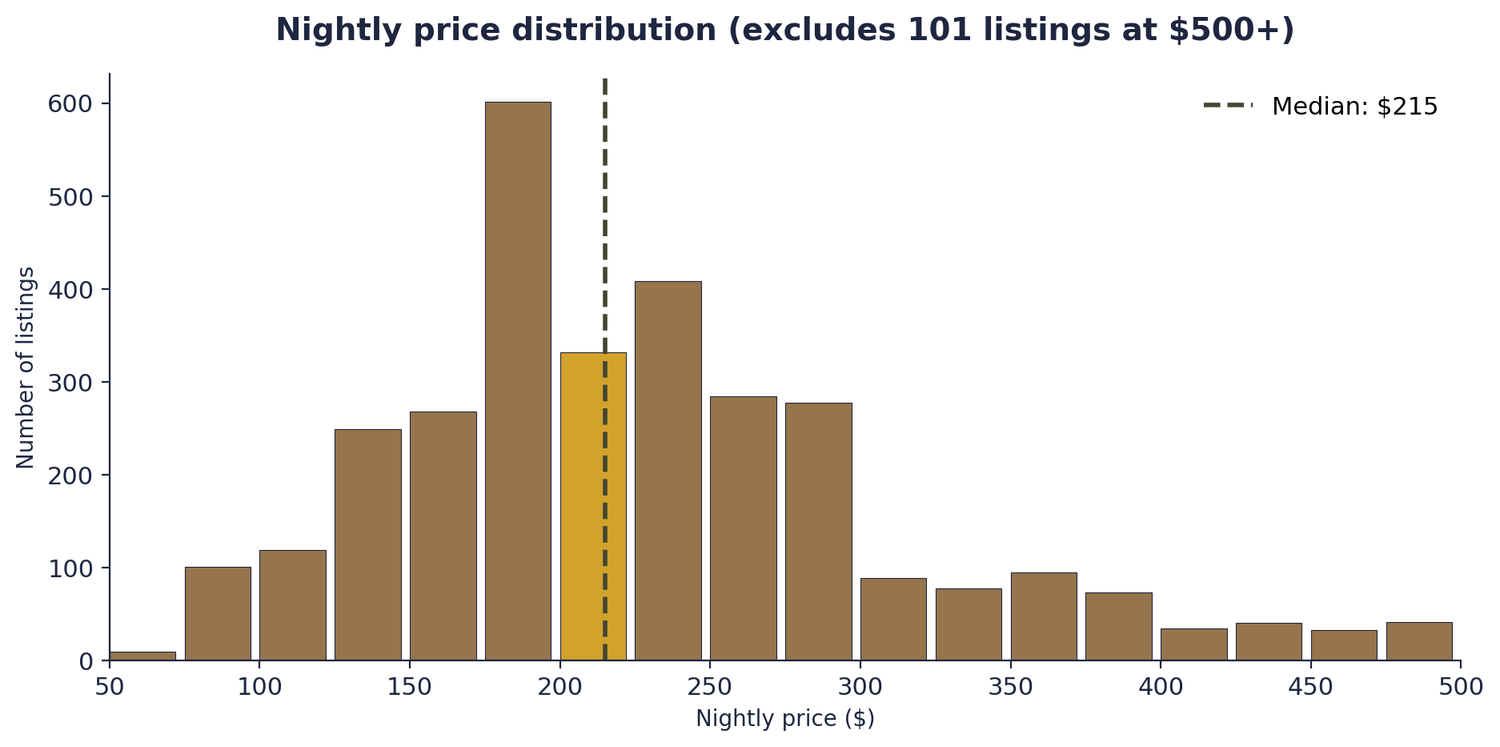
- Finding 07 The pricing anchor is around $215 a night. The median nightly rate is $215 (excluding 101 listings priced at $500+). Half of listings fall between $175 and $269.
- Finding 08 Three metros punch well above their weight on search demand. Las Vegas, Seattle, and Chicago all see 20+ monthly searches per listing, roughly double the rate in Los Angeles. These are the tightest markets in the country.
A travel category that outgrew the pandemic

The US camper van rental market sits inside two larger industry currents. The first is the broader RV sector, which shipped 342,220 units in 2025 for a 2.5% increase over 2024, with the RV Industry Association forecasting a further 2.8% rise in 2026 to a median of 349,300 units.1 The second is the outdoor hospitality market, which KOA's 2026 Camping & Outdoor Hospitality Report put at 52 million North American households camping in 2025 and a $66 billion local economic footprint.2
Both data points matter here because they help size the rental opportunity. KOA's 2026 survey found that 48% of campers said they are very likely to rent an RV in 2026, with cost and lack of operational knowledge cited as the primary barriers to ownership.2 Camper vans sit neatly at the intersection of those two barriers: they are the most affordable class of motorized RV to rent, and they are the easiest for a first-time RVer to drive.
Within the rental market, peer-to-peer platforms have emerged as the main distribution channel. Grand View Research projects US peer-to-peer camping and caravanning rental sales to grow at a 9.0% CAGR from 2026 to 2033, well ahead of the overall RV rental market.3
At roughly 40 US searches per listing every month, the camper van rental category has a healthy demand-to-supply ratio. For context, that is more than double the ratio seen in many other niche travel rental categories. The category's addressable demand has real weight; the supply side is where the more interesting variation lives.
Who owns the fleet, and what it looks like
The US camper van rental fleet is defined by three patterns: private-host dominance, a very young vehicle mix, and a clear preference for smaller configurations.
Who owns the supply
Three out of every four listings (74.6%) are owned by private individuals rather than dealerships or commercial rental fleets. The remaining 25.4% come from dealers. This skew matters: it means the supply side of the market is largely a consumer-to-consumer business, with individual owners renting their vehicles to offset ownership costs or generate supplemental income.
Beyond ownership structure, delivery is a meaningful differentiator. 55.8% of listings offer delivery to a separate pickup location, which is especially important in markets where airports are far from the host's home base.
How new the fleet is
The fleet skews unusually new. 48.1% of listings are model year 2020 to 2023, with the median vehicle a 2021 model. Roughly 60% of all listings are 2020 or newer. Only 12.6% are pre-2010.
"The fleet is anchored by a pandemic-era surge. Nearly half of all listings are model years 2020-2023."
That age profile has two implications. First, these are high-insurance, high-capital-cost assets for the hosts who own them: a typical 2021 Sprinter-based build costs well into six figures. Second, renters coming into the category get a relatively consistent product quality, which lowers the risk of the first-time rental experience being an outlier disappointment.
Who these vans are built for
The fleet is overwhelmingly oriented toward solo travelers, couples, and small families. Half of all listings (50.5%) sleep one or two people, and another 43.1% sleep three or four. Only 6.4% of listings can sleep five or more.
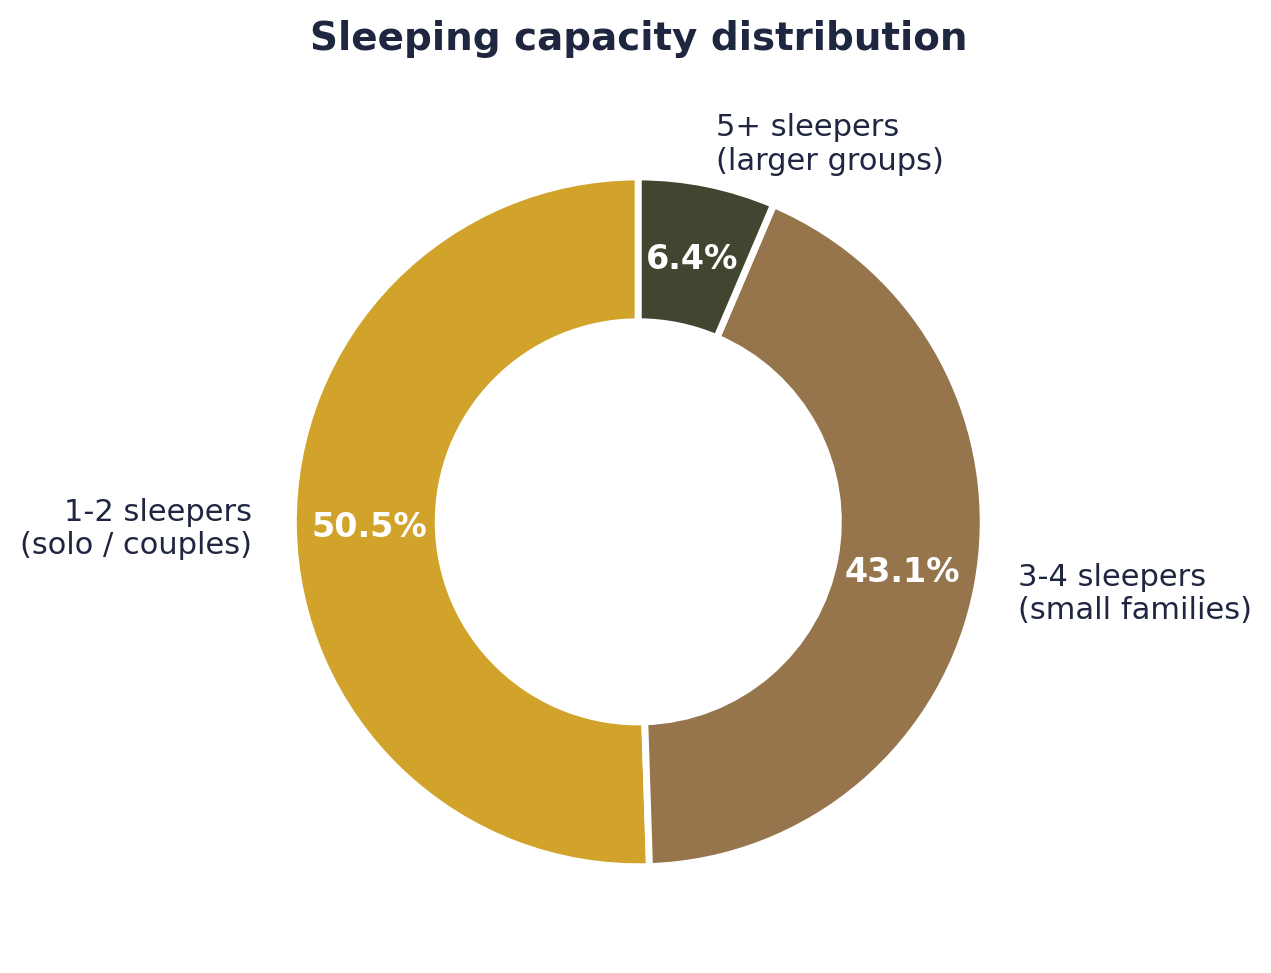
This is the single most important thing to understand about the category: camper vans are a two-person-trip product. The supply is built for couples and solo travelers first, families with young kids second. Larger groups typically move to Class A motorhomes or travel trailers rather than Class B / conversion camper vans.
Where the camper vans are

Camper van supply in the US is concentrated west of the Mississippi, and within that Western cluster it concentrates again into a relatively small number of metro areas. The gap between the supply map and the demand map is what makes this category interesting to operators and worth studying for anyone trying to understand the travel category.
State-level supply
California alone accounts for 24.4% of the camper van rental listings in our dataset, more than the next three states combined. Colorado, Oregon, and Washington round out the top four, and Hawaii places fifth despite being a comparatively tiny market geographically.
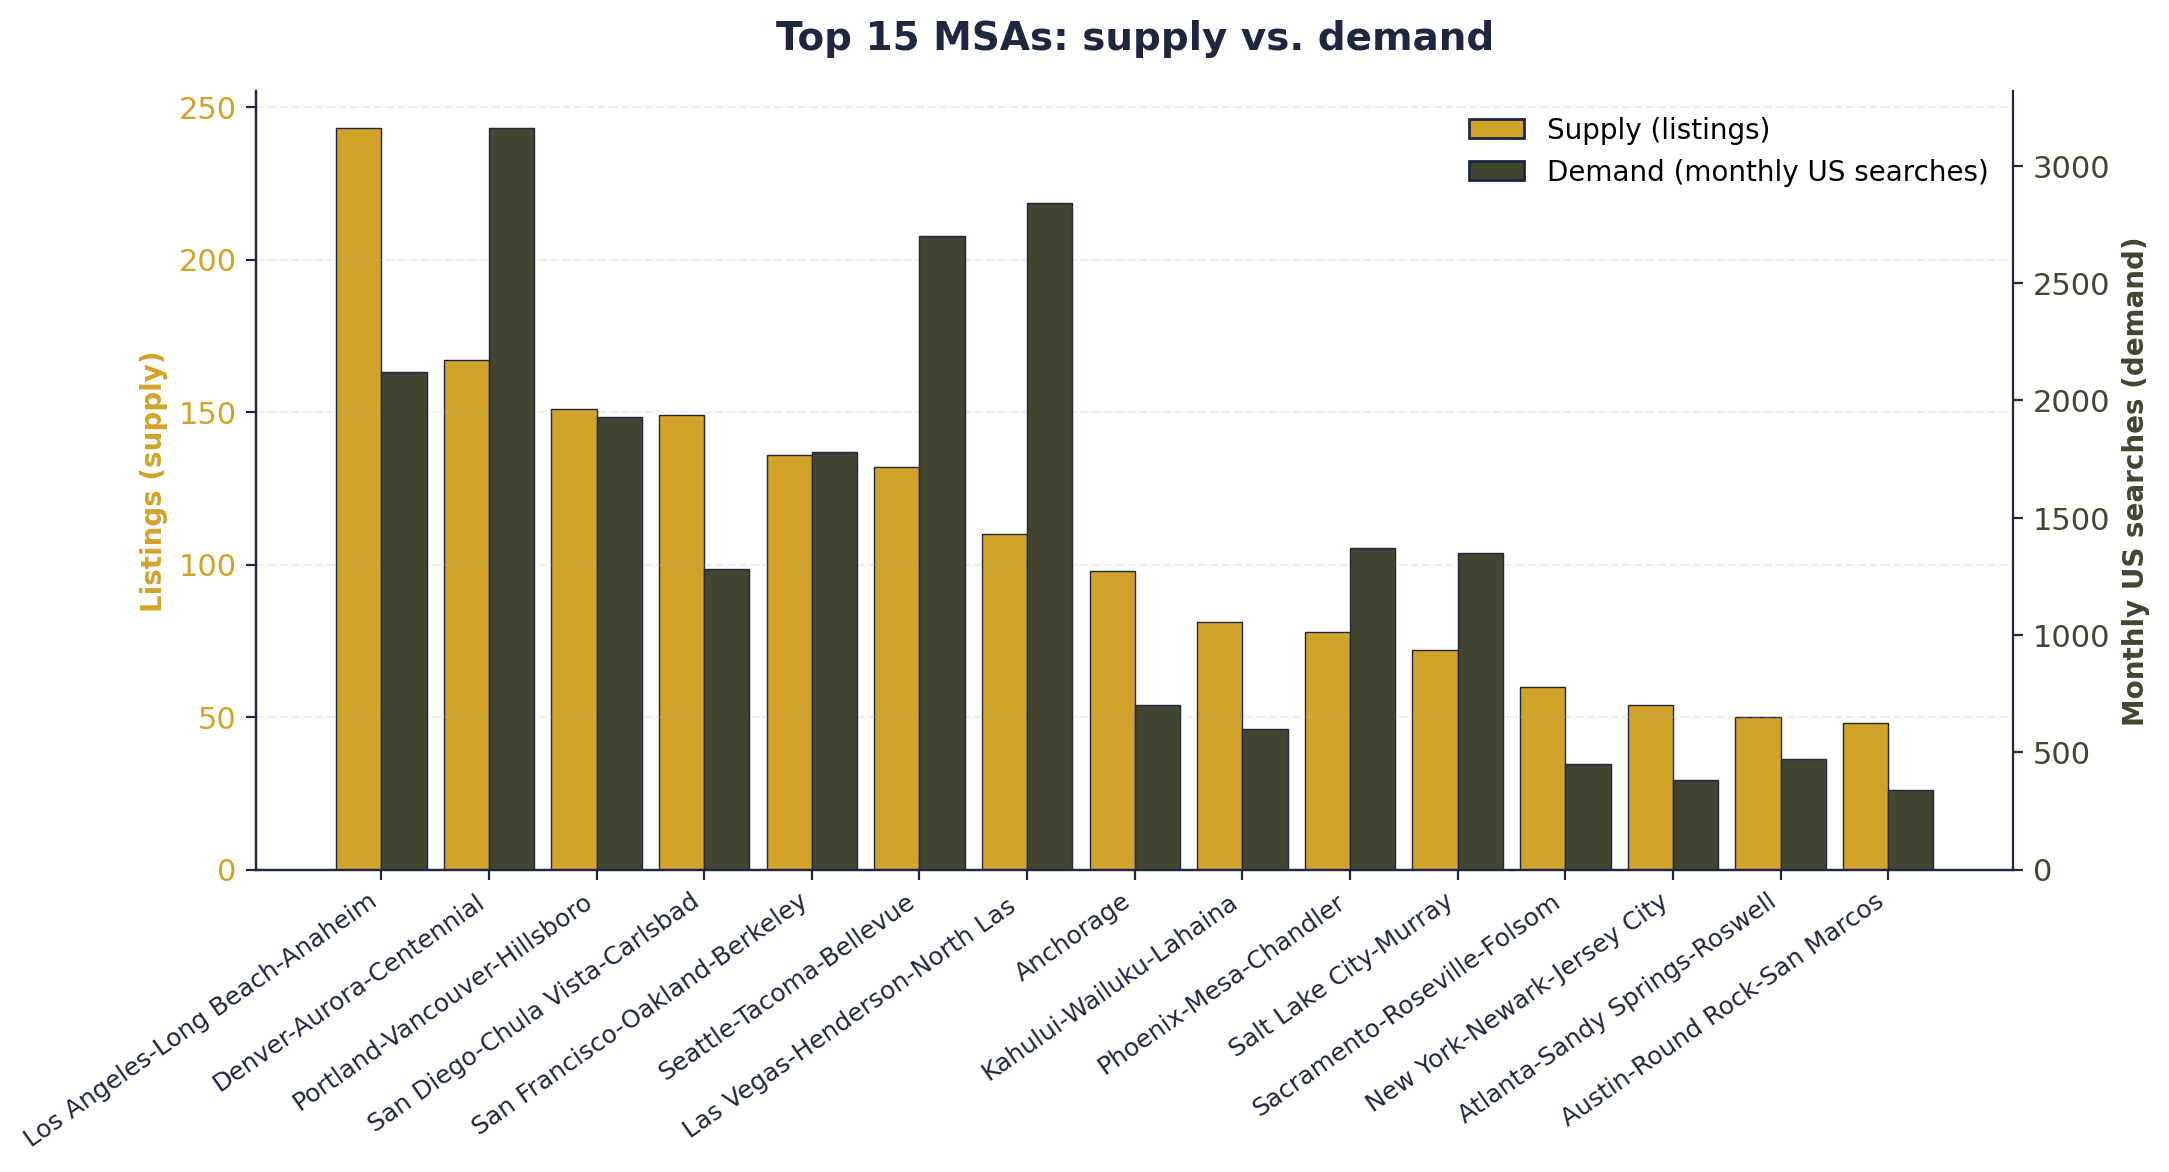
The top 15 MSAs account for a majority of analyzed listings.
Rolling state-level supply up to US Census Metropolitan Statistical Areas (MSAs) reveals a much sharper picture. The top 15 MSAs account for a majority of total listings. Los Angeles leads with 243 listings, followed by Denver (167), Portland (151), San Diego (149), and San Francisco (136). Only 4 of the top 15 MSAs are East of the Mississippi.
Pairing supply with demand shows that these rankings don't line up perfectly. Denver sees more searches than Los Angeles despite having a third the supply. Las Vegas and Seattle both see search volumes close to Los Angeles on much smaller fleets. Conversely, Anchorage and the Maui MSA have meaningful supply but comparatively lower search volume.
This mismatch between where the supply sits and where searchers are looking is the defining market structure feature. It is what drives rental demand into a handful of metros that happen to be both major airports and gateways to outdoor destinations, even when local supply is modest.
The Demand Index: where supply is tightest
To make the mismatch measurable, we calculated a Demand Index: monthly US search volume divided by local listings, for MSAs with at least 20 listings. A higher number means more demand chasing each unit of supply.
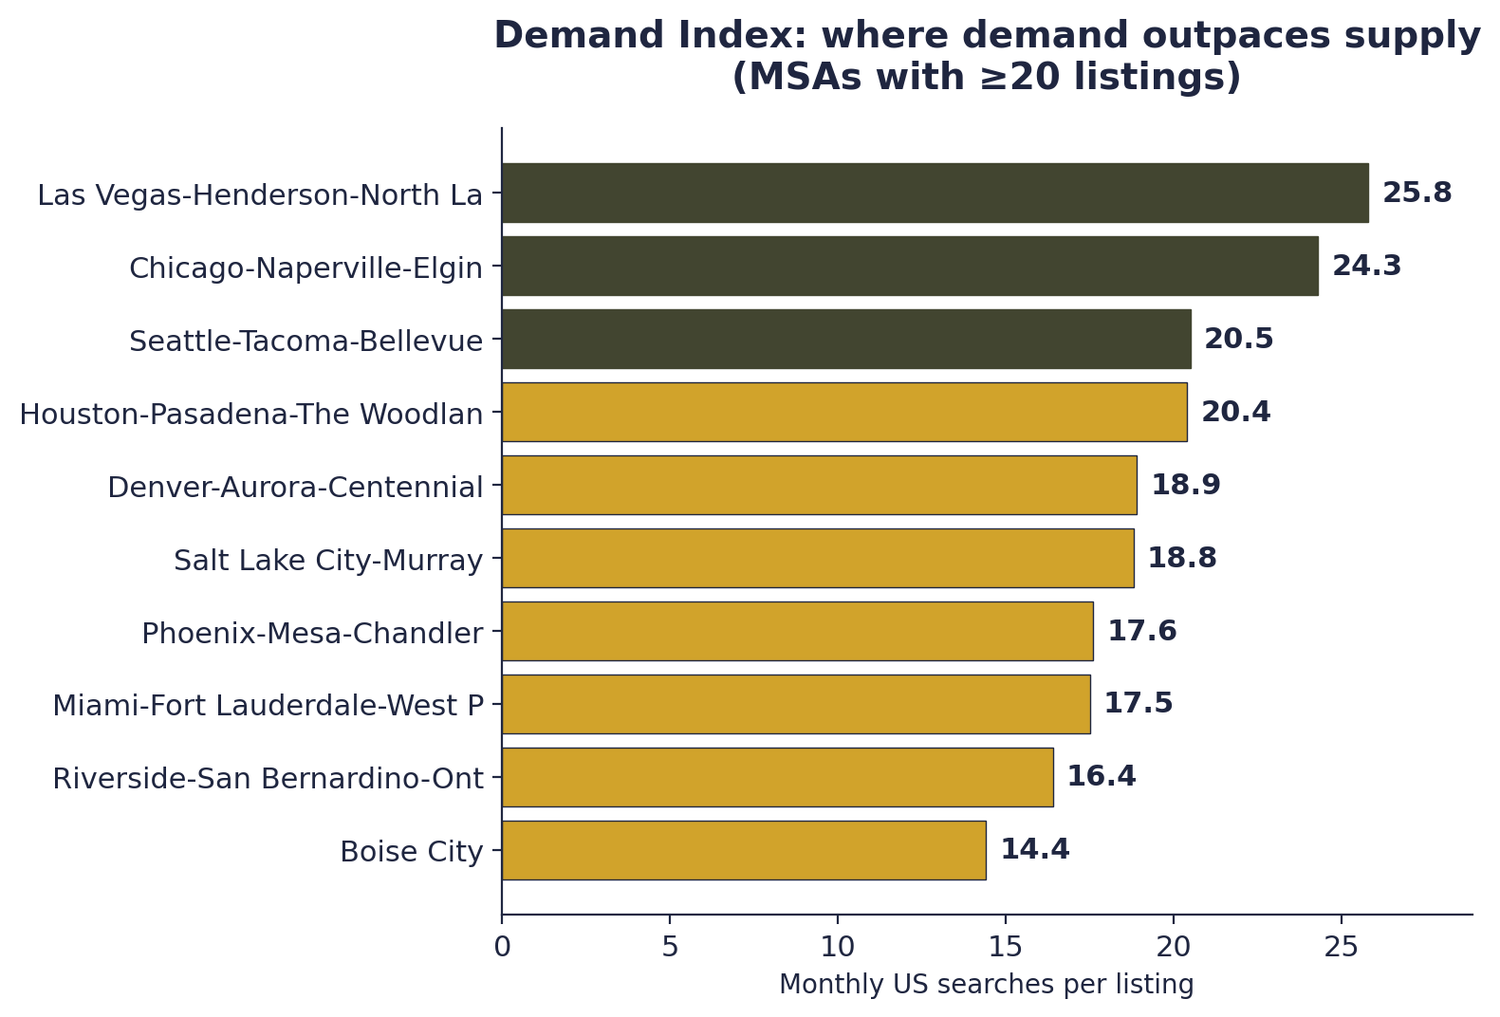
"Las Vegas sees 26 monthly US searches per listing, roughly three times the rate in Los Angeles. It is the tightest major metro market in the country."
The Demand Index tells a different story than the raw supply ranking. The tightest markets in the country are Las Vegas, Chicago, Seattle, Houston, and Denver. Each of these metros combines solid supply with very high search volume. By contrast, Los Angeles and San Diego, which dominate the raw supply ranking, have much lower demand indexes.
Who builds the vehicles on the road
Camper vans are built in two distinct ways, and the data set reflects both. Some listings identify by the chassis platform underneath the van (Mercedes-Benz Sprinter, Ford Transit, Ram ProMaster). Others identify by the brand manufacturer that did the conversion on top of that chassis (Winnebago, Thor, Airstream). Both identifications coexist in the marketplace.
Of 3,243 listings analyzed, 1,780 identified by chassis, 1,378 identified by manufacturer, and 85 used custom or unclassifiable labels.
Top chassis platforms
Among listings identified by chassis platform, Mercedes-Benz is the clear leader at 34.3%, driven by the Sprinter's dominant position as the premium camper van platform. Ford is second with 22.3% share, primarily through the Transit line. Dodge and Ram together (both Stellantis brands, with Ram being the modern ProMaster designation) account for roughly 23.9%.
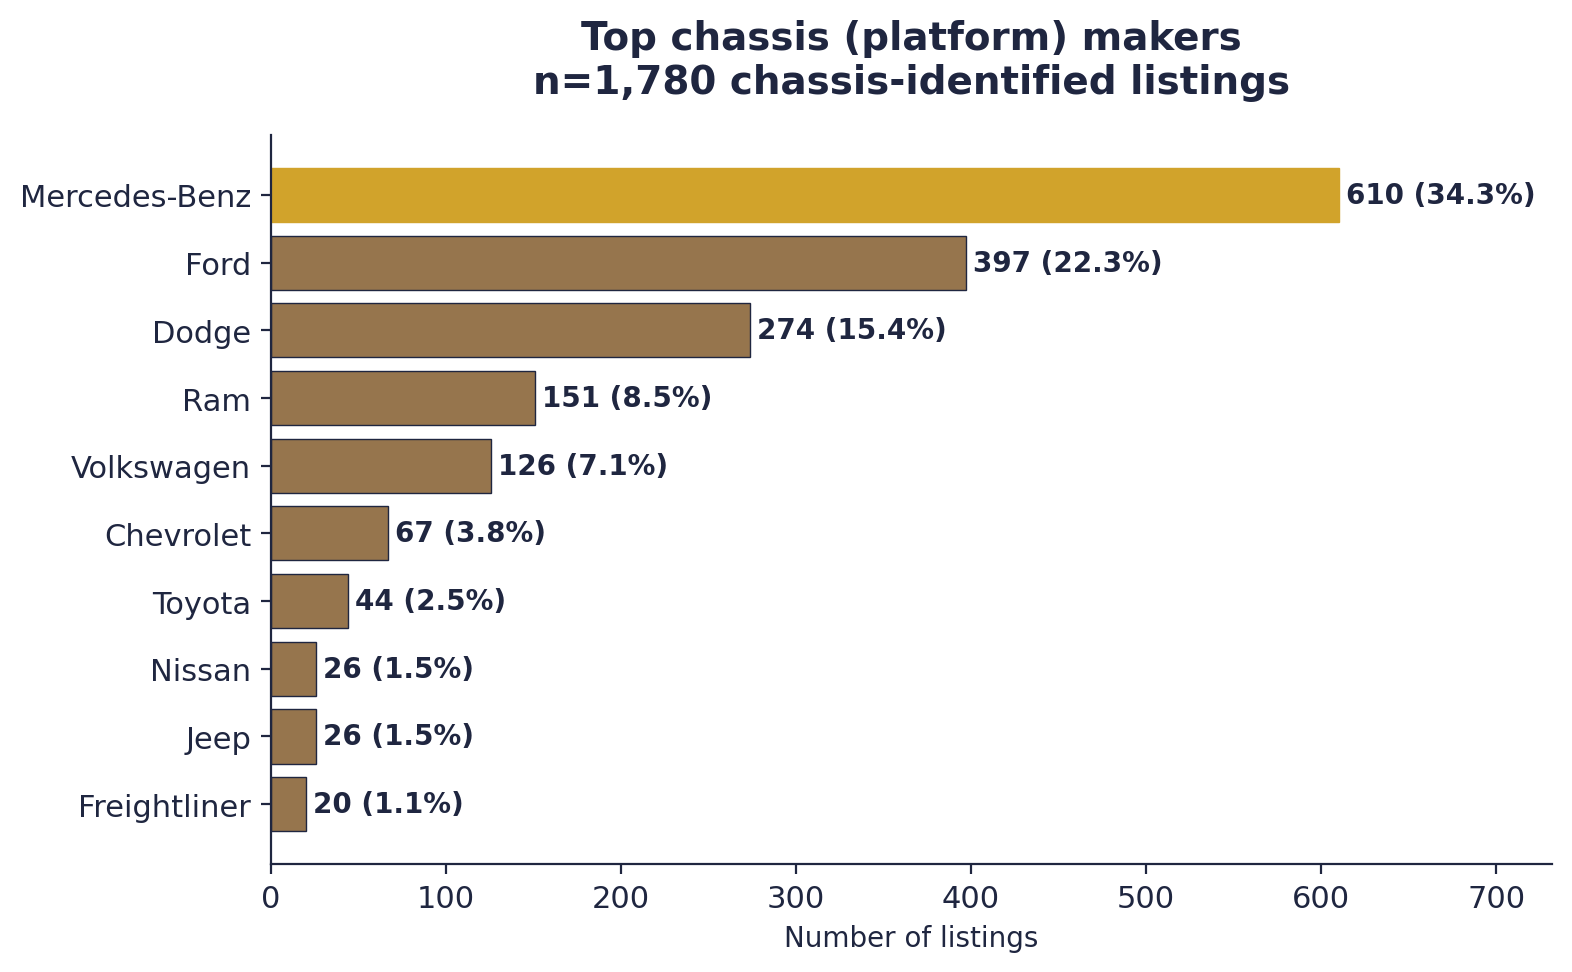
The Mercedes-Benz concentration is meaningful for renters: it creates a relatively uniform product experience across the top third of the market, since Sprinter-based builds share similar dimensions, driving characteristics, and interior volume constraints.
Top camper van manufacturers
Among listings identified by manufacturer, Winnebago holds 38.2% share, more than twice the next-largest brand. Thor sits at 13.9%, followed by Ultimate Toys, Airstream, and Roadtrek. Together, the top five manufacturers account for roughly 69.4% of the manufacturer-identified fleet.
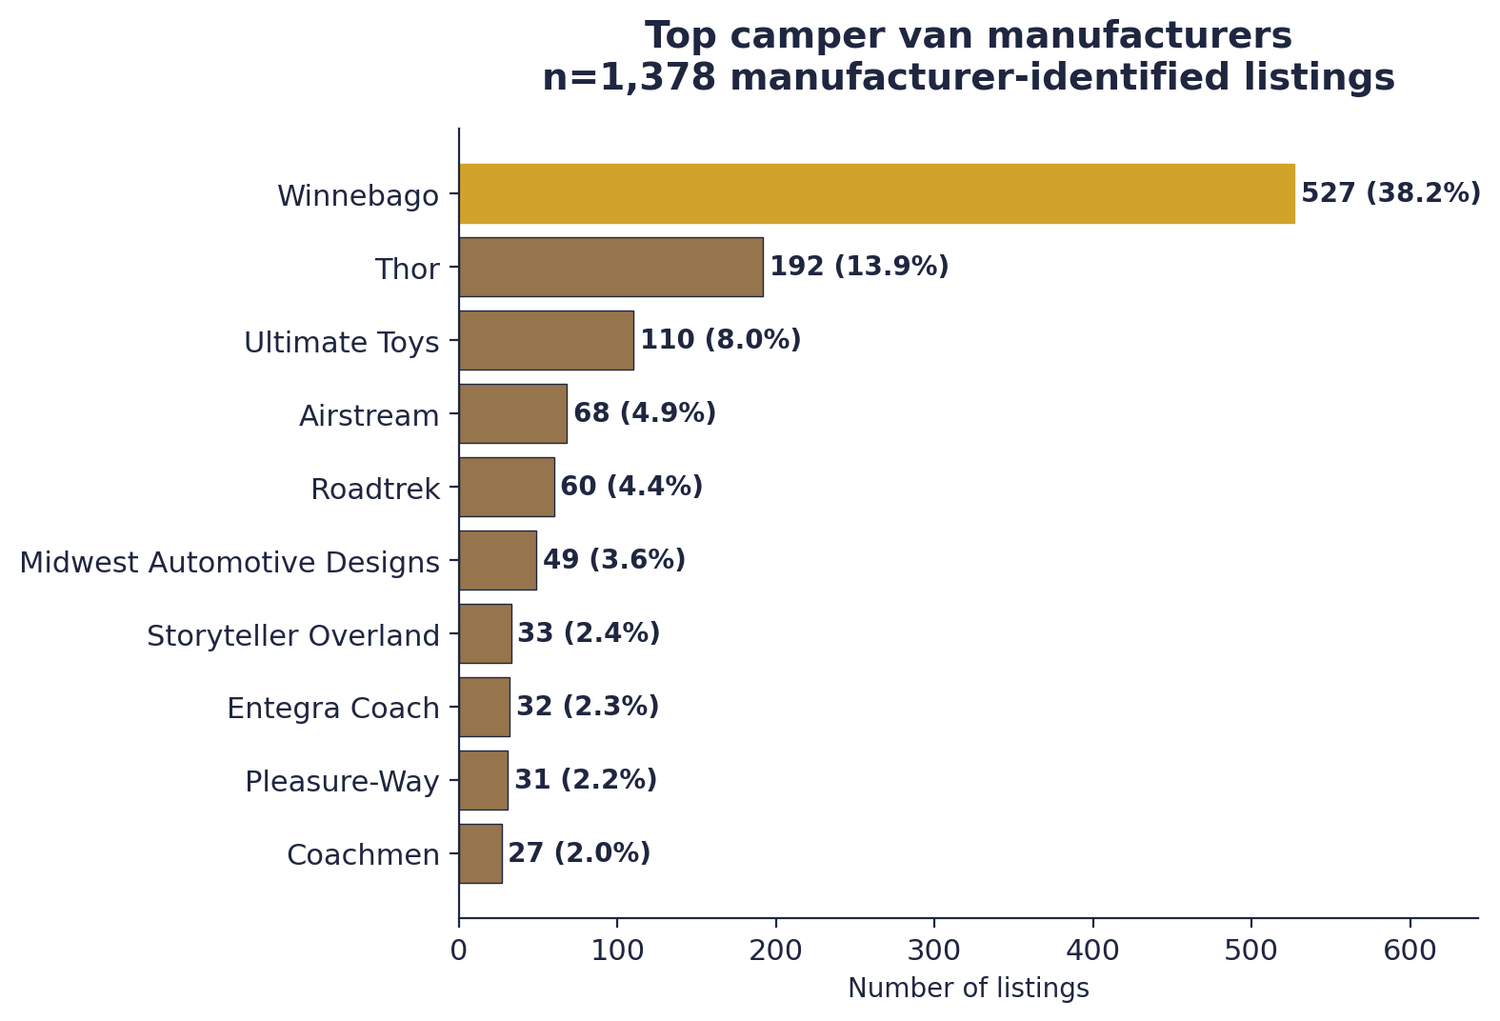
"Nearly four in ten identified-manufacturer listings are Winnebago builds. It is the single most common brand in the category."
Winnebago's position is a function of both history and scale. It was one of the earliest large-scale manufacturers of Class B motorhomes, and its Revel, Travato, and Solis lines remain among the most recognizable product names in the category. Thor Motor Coach, the second-largest brand, shares much of the same distribution footprint through its Tellaro and Sequence product lines.
The long tail of smaller conversion-focused manufacturers (Storyteller Overland, Midwest Automotive Designs, Ultimate Toys, and dozens of regional builders) represents the part of the market where individual craftsmanship and unique floor plans matter more than scale.
What a camper van actually costs to rent

The median US camper van rents for $215 per night. Half of all listings fall between $175 and $269 per night, and 90% fall below $350. These figures exclude 101 listings priced at $500 or more per night, which skew the distribution and represent a different product tier (high-end bespoke conversions).
Pricing by chassis and manufacturer
Nightly pricing varies substantially with chassis platform. Mercedes-Benz Sprinter builds command a clear price premium, with a median nightly rate higher than any other meaningful chassis platform in the dataset. Ford Transit and Ram ProMaster builds cluster at meaningfully lower price points.
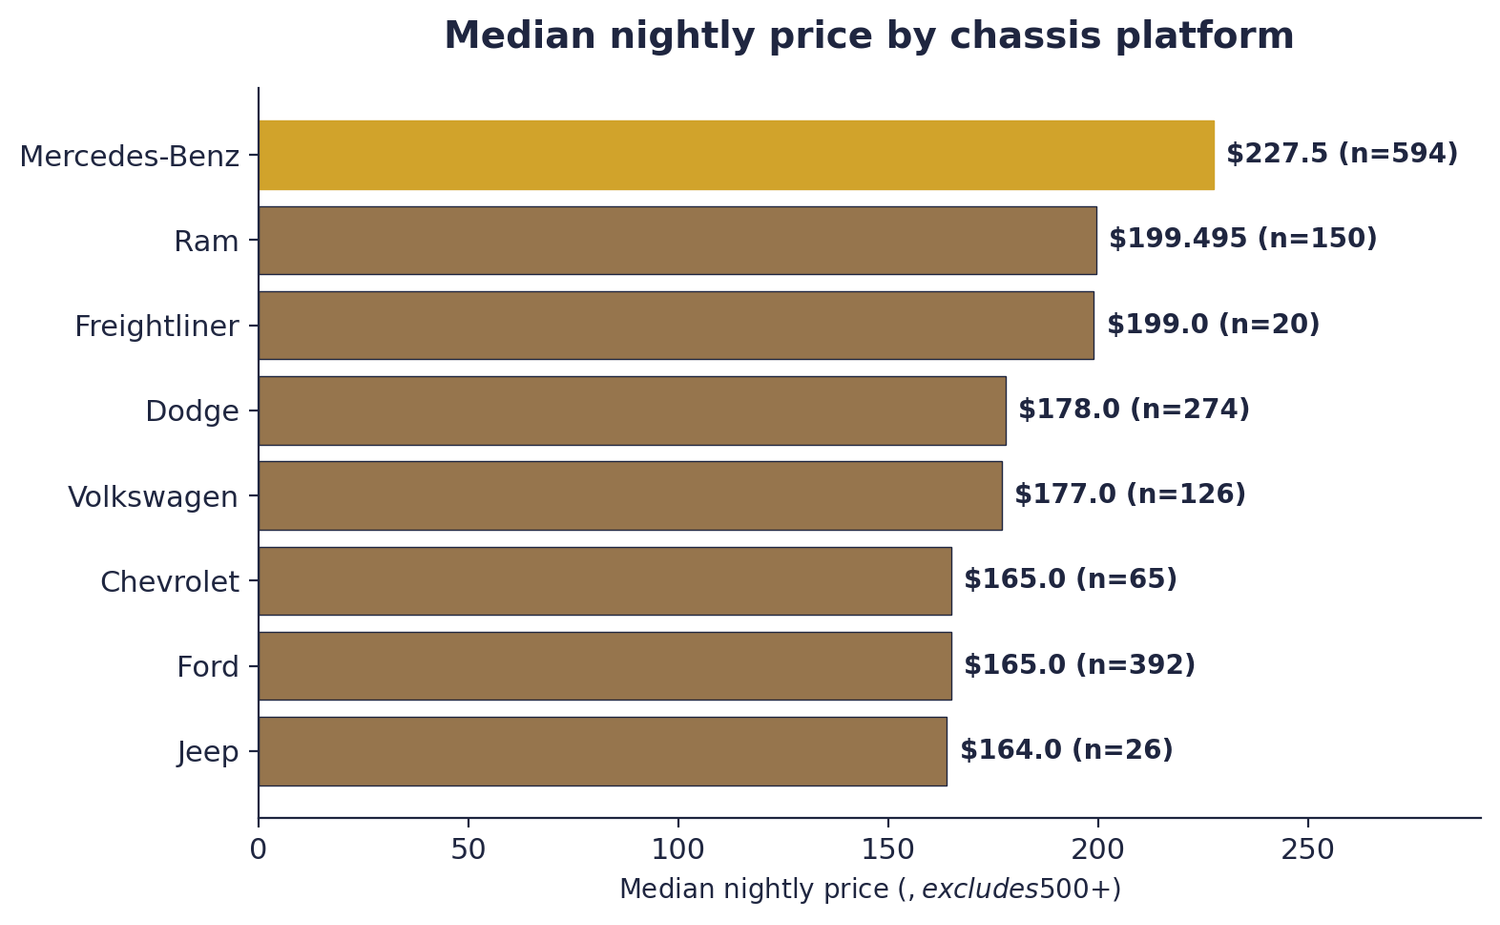
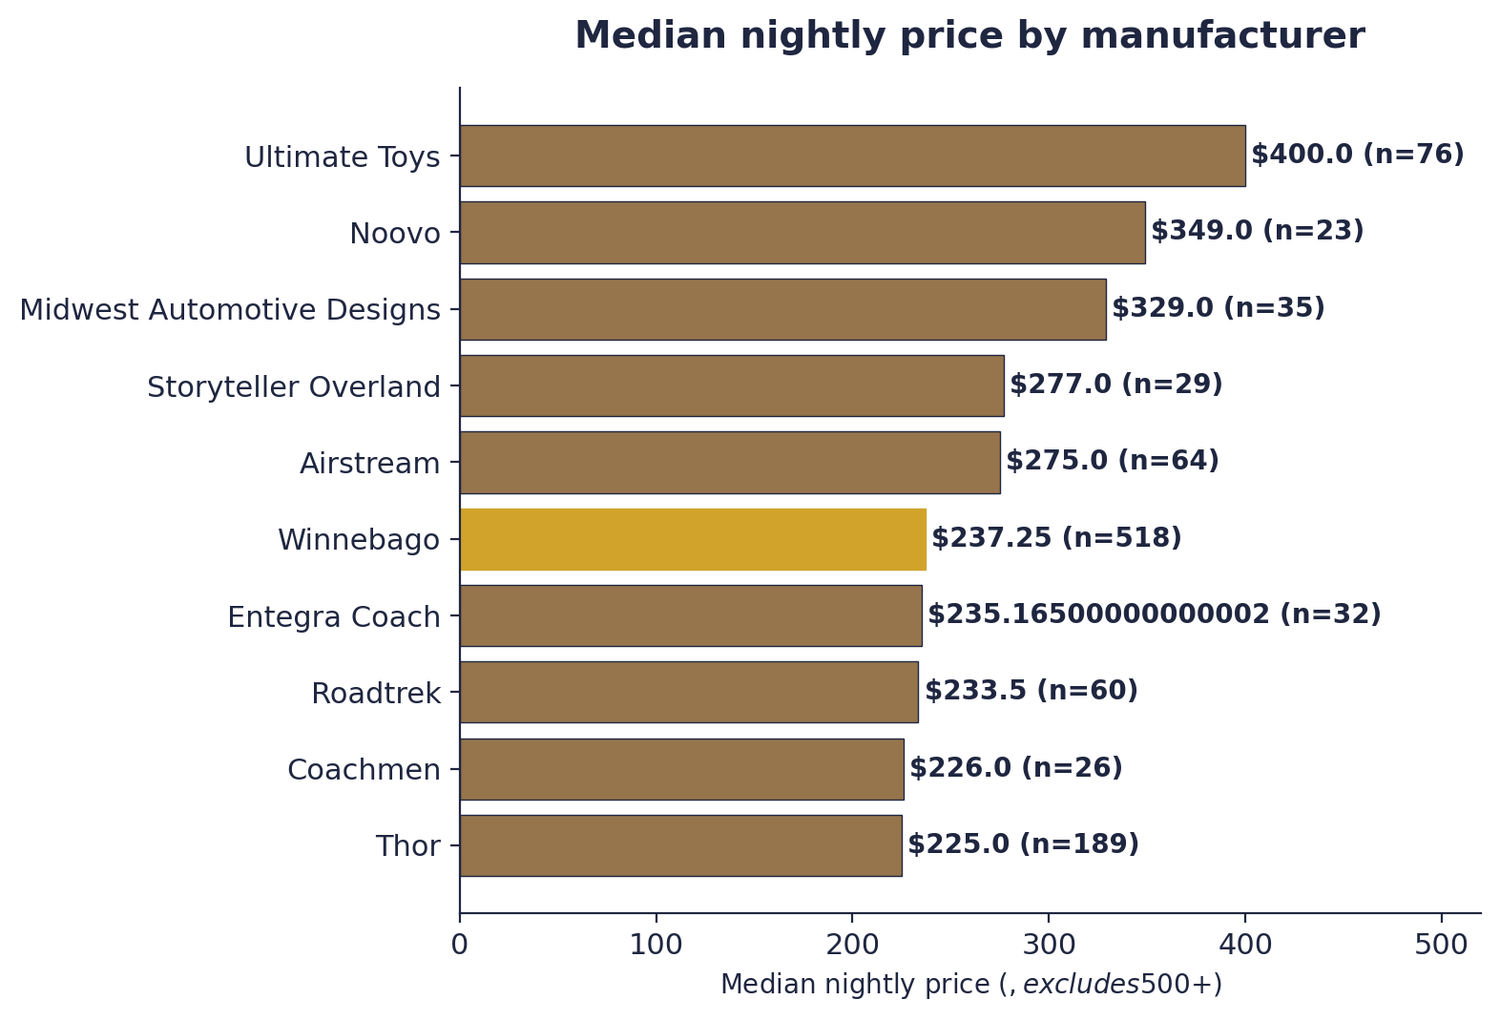
A similar pattern appears across manufacturers, where the boutique conversion brands and luxury-focused builders price above the volume brands. Winnebago, as the volume market leader, sits roughly in the middle of the manufacturer pricing distribution.
Fees, deposits, and the true cost of a rental
Nightly rate is the headline number, but it is not the full cost. The typical rental carries two additional significant line items: a refundable security deposit and a one-time preparation fee. Across our dataset, the median security deposit is $750 (n=3,224) and the median prep fee is $119 (n=2,610).
On top of these, most rentals add a daily insurance or protection plan. Renter-optional protection products on peer-to-peer platforms typically run $30 to $80 per day depending on coverage tier, with $50 per day being a common middle-of-the-road choice.
Length-of-stay discounts are near-universal in the category. While specific tier percentages vary by host, common patterns include roughly 15% off the daily rate for 7-day rentals, 20% off for 14-day rentals, and 25% off for 30-day rentals.
What a real rental costs: four trip lengths
| Trip length | Nightly after discount | Insurance ($50/day) | Prep fee | Total cost | Per-day cost |
|---|---|---|---|---|---|
| 3 days | $645 | $150 | $119 | $914 | $304/day |
| 7 days (-15%) | $1,279 | $350 | $119 | $1,748 | $249/day |
| 14 days (-20%) | $2,408 | $700 | $119 | $3,227 | $230/day |
| 30 days (-25%) | $4,837 | $1,500 | $119 | $6,456 | $215/day |
Assumptions: $215 median nightly base rate, $50/day insurance, $119 median prep fee. Discounts assumed at 0%, 15%, 20%, and 25% for 3, 7, 14, and 30-day trips respectively. Security deposit of $750 assumed refundable and therefore not included in total cost. Actual totals vary by host, vehicle, season, and promotional activity.
The effective per-day cost drops meaningfully with trip length. A 3-day weekend rental runs roughly $300 per day all-in, while a 30-day rental brings the effective rate down to about $215 per day, a 30% reduction. This pattern is part of why the rental category is trending toward longer trips rather than weekend-scale bookings.
Where the market is tightest
Synthesizing the earlier supply and demand data into a single picture, the US camper van rental market has a clear set of metros where demand meaningfully outpaces local supply. These are markets where a renter searching on any given day has fewer vehicles to choose from relative to the level of competing searcher interest.
Tightest metros: demand per listing
| MSA | Local listings | Monthly US searches | Searches per listing |
|---|---|---|---|
| Salem | 5 | 200 | 40.0 |
| San Antonio-New Braunfels | 6 | 220 | 36.7 |
| Boston-Cambridge-Newton | 11 | 400 | 36.4 |
| Albuquerque | 12 | 430 | 35.8 |
| Orlando-Kissimmee-Sanford | 9 | 320 | 35.6 |
| Flagstaff | 5 | 170 | 34.0 |
| Tucson | 6 | 200 | 33.3 |
| Chattanooga | 5 | 160 | 32.0 |
| Cincinnati | 6 | 180 | 30.0 |
| Detroit-Warren-Dearborn | 6 | 180 | 30.0 |
Source: altCamp analysis. Top 10 MSAs with supply ≥5 and meaningful demand, ranked by searches per listing.
What links these markets is a common pattern: each is either a major metropolitan population center with comparatively less local rental supply, or an outdoor-destination gateway metro where travelers are searching for rentals in visible but supply-constrained local markets.
The macro picture: where the category is heading
Putting the supply and demand sides together: the US camper van rental market has an established fleet (3,243 listings), a healthy demand base (122K monthly US searches), and enough geographic variation that no single market tells the whole story.
Looking forward, three structural forces point toward continued category expansion. First, RVIA projects another 2.8% rise in total US RV shipments in 2026.1 Second, KOA's 2026 report found that 48% of campers said they are very likely to rent an RV in 2026, with 31% planning to spend more nights under the stars than in 2025.2 Third, peer-to-peer RV rental sales in the US are forecast to grow at a 9.0% CAGR through 2033, meaningfully faster than the overall rental market.3
The combination of a maturing supply base, consistent consumer demand, and accelerating peer-to-peer adoption suggests that the 2026 picture captured in this report is a baseline, not a ceiling. Expect the supply-demand gaps documented above to tighten further as more hosts enter the market and more first-time renters convert from ownership consideration to rental experimentation.
How this report was built
Data sources
Supply side: 3,243 active US camper van (Class B and conversion) rental listings aggregated from the Outdoorsy marketplace as of April 2026. Each listing includes vehicle make, model, year, sleeping capacity, nightly price, security deposit, prep fee, pickup city and state, delivery availability, and host type (private individual vs. dealer). Hawaii, Alaska, and all 48 contiguous states are represented.
Demand side: 4,952 keywords containing "camper van rental" or close variants as a broad match, pulled from Semrush's US database in April 2026. Each keyword includes monthly US search volume, searcher intent classification, Keyword Difficulty, and SERP features.
Industry context: Published reports from the RV Industry Association, KOA (Kampgrounds of America), and Grand View Research. See Source List below for specific citations.
Key analytical decisions
Scope. For this report, "camper van" covers both factory Class B motorhomes (Roadtrek, Winnebago Travato, Coachmen Galleria) and conversion-style camper vans (Storyteller, Ultimate Toys, Midwest Automotive Designs, Vanspeed, and custom builds). The terms are treated as synonymous throughout, consistent with how both the marketplace and searchers use them.
Make normalization. Raw listing-level make strings were normalized into two categories: chassis (Mercedes-Benz, Ford, Ram, Dodge, Volkswagen) and manufacturer (Winnebago, Thor, Airstream). Listings that used custom or unclassifiable make strings were categorized as Other (2.6% of the fleet).
Geographic rollup. City-level listing data was aggregated to US Census Metropolitan Statistical Areas (MSAs) using strict Census definitions. 89.2% of listings mapped to a defined MSA. Note that San Jose is treated as its own MSA (San Jose-Sunnyvale-Santa Clara), separate from the San Francisco-Oakland-Berkeley MSA, per Census definitions.
Demand geocoding. Each Semrush keyword was parsed for US state and city references, then mapped to the corresponding MSA where possible. Head terms without geographic modifiers ("camper van rental", "camper van rentals near me") were counted in overall totals but excluded from metro-level demand aggregations.
Pricing outliers. 101 listings priced at $500 or more per night were excluded from pricing distributions and medians. These listings represent a distinct high-end product tier and their inclusion significantly skews central tendency measures. They were retained for all non-pricing analyses (supply count, geography, make/model).
Limitations
The supply data reflects a single point-in-time snapshot of active listings. Seasonality, host churn, and vehicle availability vary throughout the year; the April 2026 snapshot captures the market entering peak season. Search volume data reflects April 2026 monthly averages; individual months can vary 20-40% around the annual mean depending on travel seasonality.
[4] altCamp. US camper van rental marketplace analysis, data aggregated from the Outdoorsy marketplace, April 2026 snapshot.
[5] altCamp. Semrush US keyword database, "camper van rental" broad match, pulled April 20, 2026.
Cite this report
Data and findings from this report may be cited with attribution to altCamp. Recommended citation:
Media and research inquiries: hello@altcamp.com